Introduction
Keeping the Tor network in a healthy state is a crucial task for providing the anonymity and security guarantees Tor is promising its users. In order to do so we need to know when the network is about to become or already unhealthy. A good indicator for that is the presence (or absence) of anomalies: if the Tor network is functioning according to expectations then we can claim it's in a healthy state while being confronted with anomalies is putting that at risk. Thus, it becomes important to reliably detect and understand anomalies, and mitigate them if needed.
This document is concerned with collecting all information related to anomaly detection at Tor in a single place. Its main focus will be on detection methods proposed in the research literature and the state of implementing them or other anomaly detection means in our network-health infrastructure. We will keep this document updated as new detection methods emerge and more and more of them get incorporated into our day-to-day work. Thus, this is a working document. In case implemented algorithms are getting superseded by improved ones, we'll add the former to a section about past anomaly detection efforts to provide more context for understanding the status quo.
Scope
Anomaly and outlier detection in computer networks is a large topic1 2. We need to scope it for our purposes along several dimensions as the Tor network is an overlay network on top of the Internet, that is on top of computer networks. As such it comes with its own constraints and requirements preventing us from applying standard anomaly detection methods tailored towards computer networks 1:1 to the Tor network.
-
The Tor network is made up of thousands of relays run by volonteers around the world, yet it would be too short-sighted to just look at the state of particular relays in order to determine the health of the network. We might need to take e.g. Tor client behavior, interactions between relays in a circuit and directory authority health into account as well in order to be able to decide whether we are confronted with (potentially dangerous) anomalies or not.
-
We are concerned with the live Tor network. Anomaly detection in self-built Tor networks (like Cui et al.3 were focusing on when investigating the measurement of anonymity in the Tor network) is out of scope.
-
We focus on particular areas of data collection and metrics under the assumptions that not all possible areas are equally important and potential anomalies often surface in seemingly unrelated data sets. Thus, focusing on covering important data (sub-)sets should give us a good general indicator of potential anomalies in the network. Once we've picked the particular areas of interest we'll be summarizing the state of knowledge/research with recommendations on which algorithms to pick for detecting anomalies in the respective area. In case there are areas important to us which are less well-studied in the literature and thus no algorithms/code available, we might be able to recommend some based on our experience and already existing implementation in our infrastructure. Even though those solutions are not vetted by independent researchers having them available is strictly better than no anomaly detection happening whatsoever.
-
Data collection and metrics at Tor are crucial for a number of purposes. We've outlined what they mean in our anomaly detection context. It's important to keep in mind that it's possible that data collection gets corrupted at any point in time resulting in measurements gaps and potentially misleading data, which in turn might influence anomaly detection both in creating false negatives and false positives.
-
Hodge, V.J. and Austin, J.: A survey of outlier detection methodologies. In: Artificial Intelligence Review, 22 (2), 2004, pp. 85-126. ↩
-
Sherenaz Al-Haj Baddar, Alessio Merlo, and Mauro Migliardi: Anomaly Detection in Computer Networks: A State-of-the-Art Review. In: Journal of Wireless Mobile Networks, Ubiquitous Computing, and Dependable Applications (JoWUA), vol. 5, no. 4, pp. 29-64, December 2014. ↩
-
Cui, J., Huang, C., Meng, H. et al.: Tor network anonymity evaluation based on node anonymity, In: Cybersecurity 6:55, 2023. ↩
Estimating baselines
Estimating baselines for particular metrics means determining when numbers are expected compared to situations where they are beyond expectations and thus anomalous. This task is both crucial and often difficult at the same time. Take for example the following screenshot:
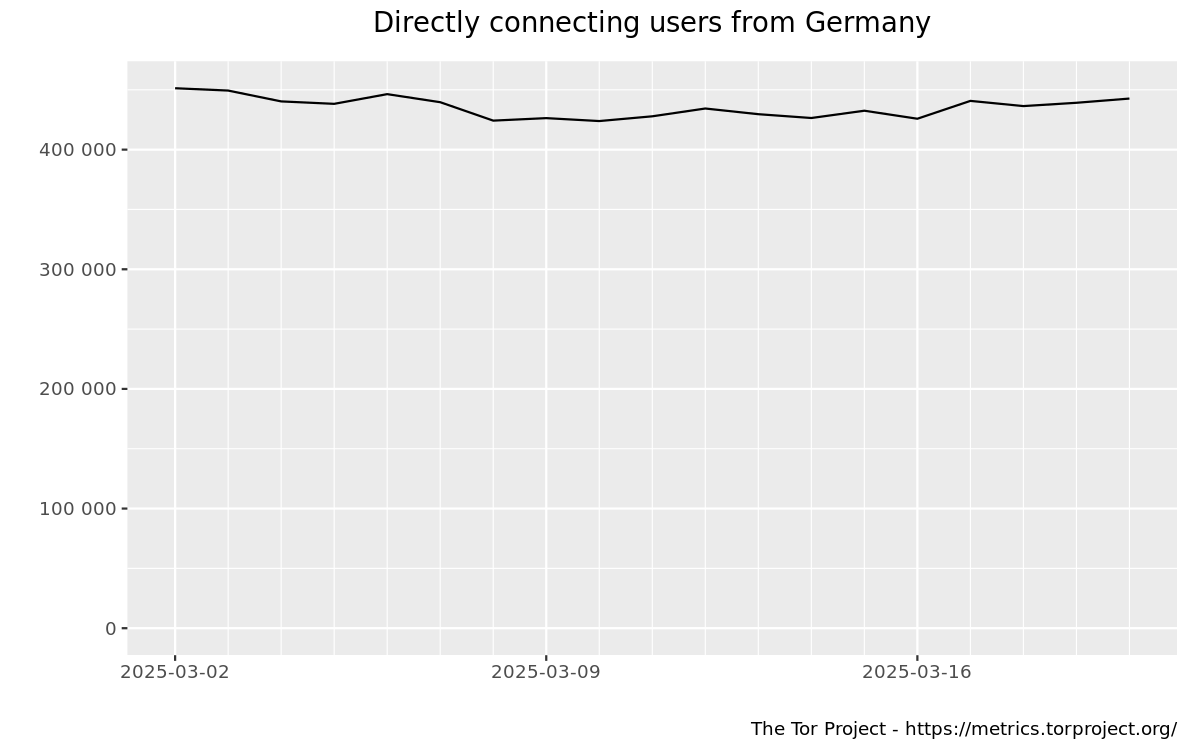
which is taken from our Metrics website. It suggests that 400,000 to 450,000 users1 are connecting daily to Tor from Germany. Given the flat graph over the 2 week window, this seems like a good candidate for a user baseline. However, things are already getting murkier if we increase the timeframe under consideration to 1 year:
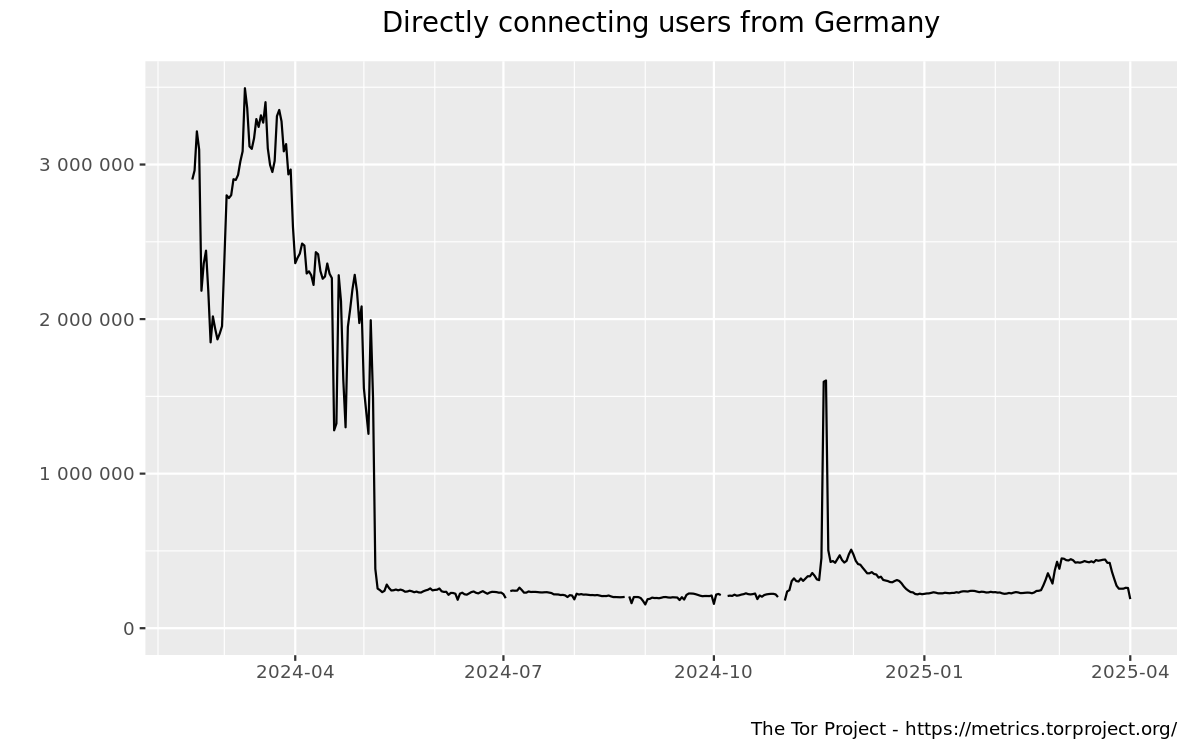
or look even further back:
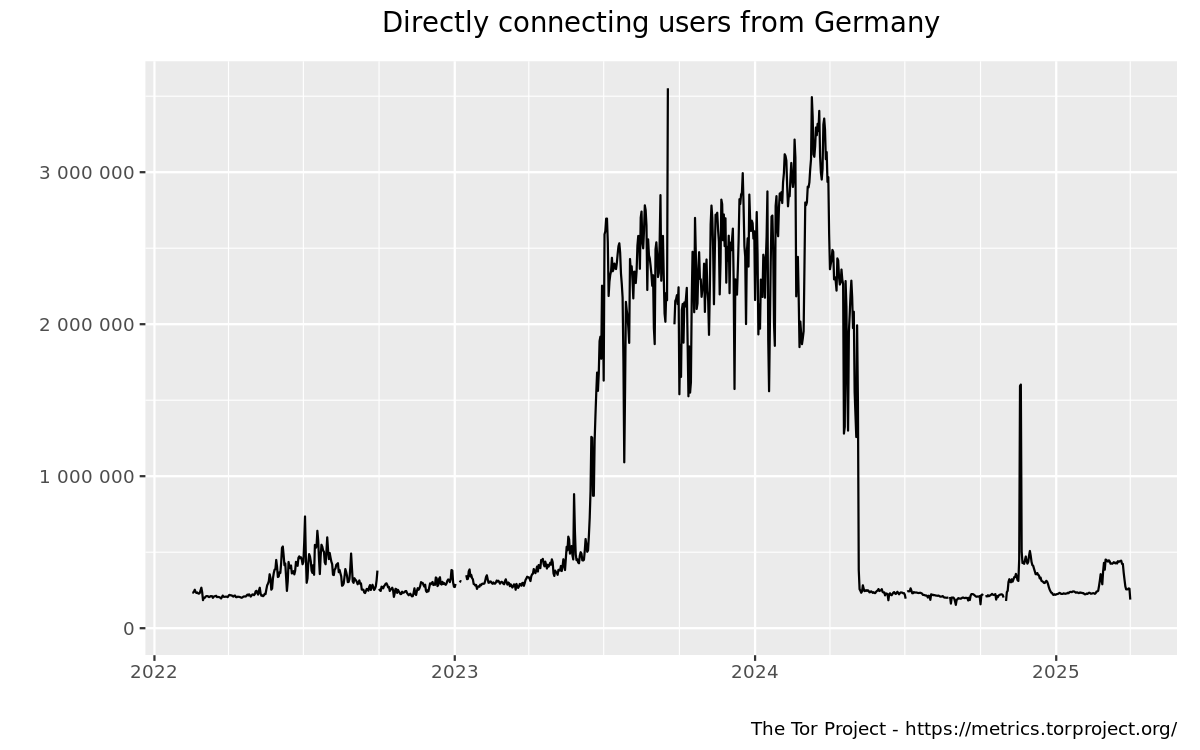
. Now big spikes in 2023/2024 look like the outliers and even the graph in the first image above seems to belong into this category. So, picking a proper timeframe is crucial.
Apart from finding the right timeframe for determining a proper baseline, we need to take other challenges into account as well. One of them is that our metrics and data we need to look at are quite different in kind. For instance, there are the numbers of directly connecting users to Tor (like the ones shown in the previous figures) which are not in our control and are, ideally, increasing over time, in a healthy way. In addition to that, we might have metrics governing some Tor protocal compliance/failure where already a single case of failure is pointing towards an anomaly. Determining baselines in both cases and others we didn't mention here explicitly needs to be done differently which means we can't even necessarily share the same methodology across all areas we are concerned about.
-
"users" might be misleading in this context as what we actually know is those numbers belonging to Tor clients. It could easily be the case that there are way less real users behind those numbers of Tor clients. For details on how we arrive at our bridge and directly connecting user numbers, see e.g. the technical report on counting daily bridge users. ↩
Anomalies and attacks
There is the temptation to think of anomalies as a result of attacks on Tor, seeing them as two sides of the same coin. However, in practise, it is more complicated.
There are both attacks on Tor that show up as anomalous behavior (be it by clients, the network or individual relays) and those that are not visible. At the same time there are anomalies showing up in our data which are not related to attacks but e.g. a bug or just (un-)expected, new behavior after a feature landed and got deployed.
While it is important to figure out whether anomalies in our data are due to bugs, attacks, misconfiguration or some other reason (as a proper remedy might depend on their correct classification) we are here mostly concerned with ways of detecting them in the first place. That way we can focus on the particular techniques without getting derailed by the task of coreectly classifying them or specific incidents correctly. Thus, even though many of the papers mentioned in the upcoming sections of this document are either outlining attacks or defenses against them the scope of this work is broader than just looking at anomalies found during attacks on Tor.
Anomaly detection areas
In the following sections we'll focus on:
User anomalies
Going back to the graphs shown in the baselines section, how can we determine anomalies in them?
For censorship detecion, Danezis proposed1 in 2011 that the number of users over time in a jurisdiction is normal if it follows the trends we see in other jurisdictions. To account for weekly patterns an interval of 7 days is considered in the model, and to build typical ratios of connections the 50 largest jurisdictions are used. Given that most of them being in countries without reported mass censorship which helps with defining what a "normal" connection pattern is supposed to look like.
Issues with that model got identified2 early on: e.g. the 7 day delta makes the algorithm trigger after a censorship event got reported and there were still a considerable amount of false positives visible. However, an improved version of Danezis' algorithm taking those and other shortcomings into account didn't get fully developed.
Wright et al. published3 an improved version of anomaly detection in Tor usage that is based on a different approach: away from an event-based one, focusing on a time period instead. For that Wright et al. make use of the Principal Component Analysis (PCA)4 over a 180-day window. They ignore countries whose usage never rises above 100 users (to ignore the high variance in such data) and identify and remove seasonality effects in the data with the help of the Seasonal and Trend Decomposition using Loess (STL) method5.
While focused on detecting censorship persiods as well, the improved anomaly detection algorithm by Wright et al. is meant to be able to detect general user anomalies, too.
Implementation status
We have currently implemented Danezis' algorithm in our metrics infrastructure and make the results available on our website6. This looks like:
XXX
At the same time, we work on replacing Danezis's algorithm with the approach brought up by Wright et al. There are past anomaly/censorship reports available in the infolabe-anomalies7 archives.
-
Danezis, George: An anomaly-based censorship-detection system for Tor, 2011. (https://research.torproject.org/techreports/detector-2011-09-09.pdf) ↩
-
See: https://archive.torproject.org/websites/lists.torproject.org/pipermail/tor-dev/2013-May/004805.html and https://archive.torproject.org/websites/lists.torproject.org/pipermail/tor-dev/2013-May/004832.html for details. ↩
-
https://censorbib.nymity.ch/pdf/Wright2018a.pdf ↩
-
https://en.wikipedia.org/wiki/Principal_component_analysis ↩
-
R. B. Cleveland et al.: STL: A Seasonal-Trend Decomposition Procedure Based on Loess. Journal of Official Statistics 6 (1990), 3–73. ↩
-
https://metrics.torproject.org/userstats-censorship-events.html ↩
-
https://web.archive.org/web/20240226184836/http://lists.infolabe.net/archives/infolabe-anomalies/ ↩
Network anomalies
Directory Authorities
Churn
Winter et al.3 proposed a way to measure churn in the Tor network by keeping track of relays between two consecutive consensuses. They calculate the churn rate due to newly joined relays separately from the rate caused by relays that left the network (p.5/6): the former is obtained by dividing the number of relays not available in the previous consensus by the number of relays in the current one, while the latter is the result of dividing the number of relays available in the previous consensus (but not the current one) by the number of relays in the previous one.
To detect changes in the underlying time series trend (flat hills) they smooth the churn rates using a moving average (p.6)
In order to figure out a good threshold for raising churn related alerts they investigate several candidate thresholds based on data from 2015 (p.11/12). It turns out that a threshold of 0.012 using a smoothing window size of 24h might be a reasonable starting point as that would result in roughly one alert every other day, which is still possible to investigate.
Implementation status
Churn according to Winter et al. is currently tracked in our Grafana setup4, although there is no reporting configured yet, in case the churn rates would cross specified thresholds.
We have unrelated tooling that is taking care of large amounts of relays joining the network, though:
- DocTor5: sends an alert to the tor-consensus-health mailing list6, in case of more than 50 relays having joined the network during the last hour.
- general alerting infrastructure7: sends alerts with
different priorities to the metrics-alerts mailing list8 in
case of
- amount of relays joining per same country
- > 50 over 1h (high)
- > 50 over 24h (medium)
- amount of relays joining per same autonomous system
- > 50 over 1h (high)
- > 50 over 24h (medium)
- amount of relays joining per same flag
- > 50 over 2h (medium)
- amount of relays joining per same nickname prefix (5 characters)
- > 10 over 2h (medium)
- amount of relays joining per contact information
- > 10 over 2h (medium)
- amount of relays joining per same country
-
Höller, Tobias et al.: Analyzing inconsistencies in the Tor consensus. In: Proc. iiWAS2021: The 23rd International Conference on Information Integration and Web Intelligence 2021, pp. 487-496. ↩
-
Zhongtang Luo et al.: Attacking and Improving the Tor Directory Protocol In: Proceedings of the 45th IEEE Symposium on Security and Privacy, 2024, pp. 3221-3237. ↩
-
Winter, Philipp et al.: Identifying and characterizing Sybils in the Tor network. In: Proceedings of the 25th Usenix Security Symposium, 2016. ↩
-
See: https://grafana2.torproject.org/d/relays-cw-churn-lost-new/ and https://grafana2.torproject.org/d/churn_lost_new2/. ↩
-
https://lists.torproject.org/mailman3/postorius/lists/tor-consensus-health.lists.torproject.org/. ↩
-
See: https://gitlab.torproject.org/tpo/tpa/prometheus-alerts and https://gitlab.torproject.org/tpo/network-health/metrics/monitoring-and-alerting. ↩
-
https://lists.torproject.org/mailman3/postorius/lists/metrics-alerts.lists.torproject.org/. ↩
Relay anomalies
Tor relays provide a wealth of information about themselves when joining the network. Some of that is necessary in order to make them participate as relays, think of the IP address and ORPort they are running on or the exit policy they picked, in case the relays are exit nodes. Other information is optional and can even be faked: think of relay nicknames, operator contact information or observed bandwidth valies.
Regardless of which particular information about relays we look at, be it self-reported or measured, it's prone to anomalies. The same goes for relay behavior. At first glance that seems to be counterintuitive as we know the Tor source code (assuming the operator did not mess with that) and have a lot of experience how relays ramp up and behave while running. However, there are a number of things that, in reality, interfere at this point: there might be bugs in the source code we overlooked or plain configuration errors/experiments done by the operator. Finally, usually not all the underlying infrastructure needed for running relays is in the operator's control but might influence together with network affects what particular operators experience (and we see in our data) when running relays.1
Uptimes and restarts
As Winter et al.2 write (on p.6):
For convenience, Sybil operators are likely to administer their relays simultaneously, i.e., update, configure, and reboot them all at the same time. This is reflected in their relays’ uptime.
Being a Sybil3 operator means running relays that seem to belong to different entities while they are in fact being run by the same person or group.
Given the observation about operator behavior quoted above, Winter et al. propose an uptime matrix, which
consists of the uptime patterns of all Tor relays, which we represent as binary sequences. Each hour, when a new consensus is published, we add a new data point—“online” or “offline”—to each Tor relay’s sequence. We visualize all sequences in a bitmap whose rows represent consensuses and whose columns represent relays. Each pixel denotes the uptime status of a particular relay at a particular hour. Black pixels mean that the relay was online and white pixels mean that the relay was offline.
This is how it for example looks like for June 2016:

The interesting clusters of relays with identical uptime (5 relays at a minimum) are marked in red.
Nearest-neighbor ranking
Identical uptimes are not the only indicator for Sybil relays. Winter et al. propose another technique using the Levenshtein distance4 to quantify the similarity between two relays (p. 7):
Our algorithm turns the router statuses and descriptors of two relays into strings and determines their Levenshtein distance.
As Winter et al. noted, representing relays as strings and thereby ignoring for instance the topological proximity of IP addresses (p.15) points to significant room for improvement of the algorithm. Sui et. al.5 pick this up in a follow-up paper. They consider the following relay attributes with the respective algorithms:
| Relay attribute | Algorithm |
|---|---|
| nickname | improved Levenshtein distance |
| hostname | Jaro-Winkler similarity |
| IPv4 address | Hamming distance |
| exit policy | Jaccard similarity |
| uptime | custom6 |
| ipv4 port | data-equivalence-based approach/inverse document frequency |
| country | data-equivalence-based approach/inverse document frequency |
| as number | data-equivalence-based approach/inverse document frequency |
| version | data-equivalence-based approach/inverse document frequency |
| platform | data-equivalence-based approach/inverse document frequency |
The relay similarity score is then computed out of the similarity scores of the 10 relay attributes (p.296):
node_similarity_scores(a,b) = nickname_score ∗ 0.2 + hostname_score ∗ 0.1 + uptime_score ∗ 0.05 + exitpolicy_score ∗ 0.1 + country_score ∗ 0.05 + asnum_score ∗ 0.1 + ipv4add_score ∗ 0.1 + ipv4port_score ∗ 0.1 + version_score ∗ 0.1 + platform_score ∗ 0.1
Traffic manipulation, shaping and sniffing
When a user sends a request over a Tor circuit to a destination the assumption is that this request travels to/from the respective Tor relay IP addresses over the Tor circuit before reaching the destination and a response is getting relayed through the network back to the user similarly, both without any interference and traffic logging by parties in between. Any case that deviates from this pattern can be seen as an anomaly. 7 summarize findings both from past studies and their own research where traffic tampering or sniffing happened between the exit node and the request's destination. They encountered and documented cases of misconfiguration (DNS resolution issues, antivirus tools interfering with Tor traffic), MitM attacks (e.g. against HTTP/HTTPS traffic) and traffic snooping (stealing of FTP and IMAP credentials). 8 9
Relay bandwidth history and overload
XXX: bw faking, read/write gaps in history, overload
Implementation status
Both Winter et al.'s uptime and nearest-neightbor ranking tools are implemented
in margot10.
Monthly output of the uptime matrix is available on Gitlab pages11.
For the nearest-neighbor ranking, there is the caveat that we have a slightly
different version of it deployed, compared to what got developed in
Winter et al.'s paper, as arti, which margot is using under the hood,
doesn't have support for server descriptors available yet12.
Thus, while Sybilhunter13 computes the Levenshtein distance based
on:
| relay attribute | source |
|---|---|
| Nickname | consensus |
| OR address | consensus |
| ORPort | consensus |
| DirPort | consensus |
| Flags | consensus |
| Tor version | consensus |
| PortList | network status |
| Bandwidth average | server descriptor |
| Bandwidth burst | server descriptor |
| Operating system | server descriptor |
| Published | server descriptor |
| Uptime | server descriptor |
| Contact | server descriptor |
margot resorts to:
| relay attribute | source |
|---|---|
| Nickname | consensus |
| OR address | consensus |
| Flags | consensus |
| Tor version | consensus |
| Weight | consensus |
for now.
-
There are many examples we could bring up at this point. A particular good one is operators being (differently) affected by a large relay operator restarting their relays at a different autonomous system, see: https://gitlab.torproject.org/tpo/network-health/analysis/-/issues/105. ↩
-
Winter, Philipp et al.: Identifying and characterizing Sybils in the Tor network. In: Proceedings of the 25th Usenix Security Symposium, 2016. ↩
-
Douceur, John R.: The Sybil Attack. In: Proceedings of Peer-to-Peer Systems, 2002. ↩
-
Levenshtein, Vladimir Iosifovich: Binary Codes Capable of Correcting Deletions, Insertions, and Reversals. In: Soviet Physics-Doklady 10.8, 1966. ↩
-
Sui, J., Guo, W., Shi, X., Zhang, S., Hu, H.: Refining Node Similarity Analysis: An Optimized Nearest-neighbor Ranking Algorithm. In: IEEE 2nd International Conference on Control, Electronics and Computer Technology (ICCEC), 2024, pp.292-297. ↩
-
The authors count all the uptime values and divide the available range into 10 intervals. If the uptime difference of a relay compared to the reference relay is 0 then it gets a score of 1. If the target relay would be in the second interval (in the paper within [0,33749]) it would get a score of 0.9. Per slice further away from the reference relay the score of the target relay is reduced by 0.1 (see: p.295 for more details). ↩
-
Winter, Philipp et al.: Spoiled Onions: Exposing Malicious Tor Exit Relays. In: Proceedings of the 14th Privacy Enhancing Technologies Symposium (PETS), 2014. ↩
-
Zhang, Qingfeng et al.: ExitSniffer: Towards Comprehensive Security Analysis of Anomalous Binding Relationship of Exit Router. In: W. Lu et al. (Eds.): CNCERT 2021, CCIS 1506, pp. 93–109, 2022. ↩
-
Zhang, Qingfeng et al.: A Comprehensive Evaluation of the Impact on Tor Network Anonymity Caused by ShadowRelay. In: IEEE Symposium on Computers and Communications (ISCC), 2023, pp. 1369–1375. ↩
-
https://tpo.pages.torproject.net/network-health/online_relays ↩