Estimating baselines
Estimating baselines for particular metrics means determining when numbers are expected compared to situations where they are beyond expectations and thus anomalous. This task is both crucial and often difficult at the same time. Take for example the following screenshot:
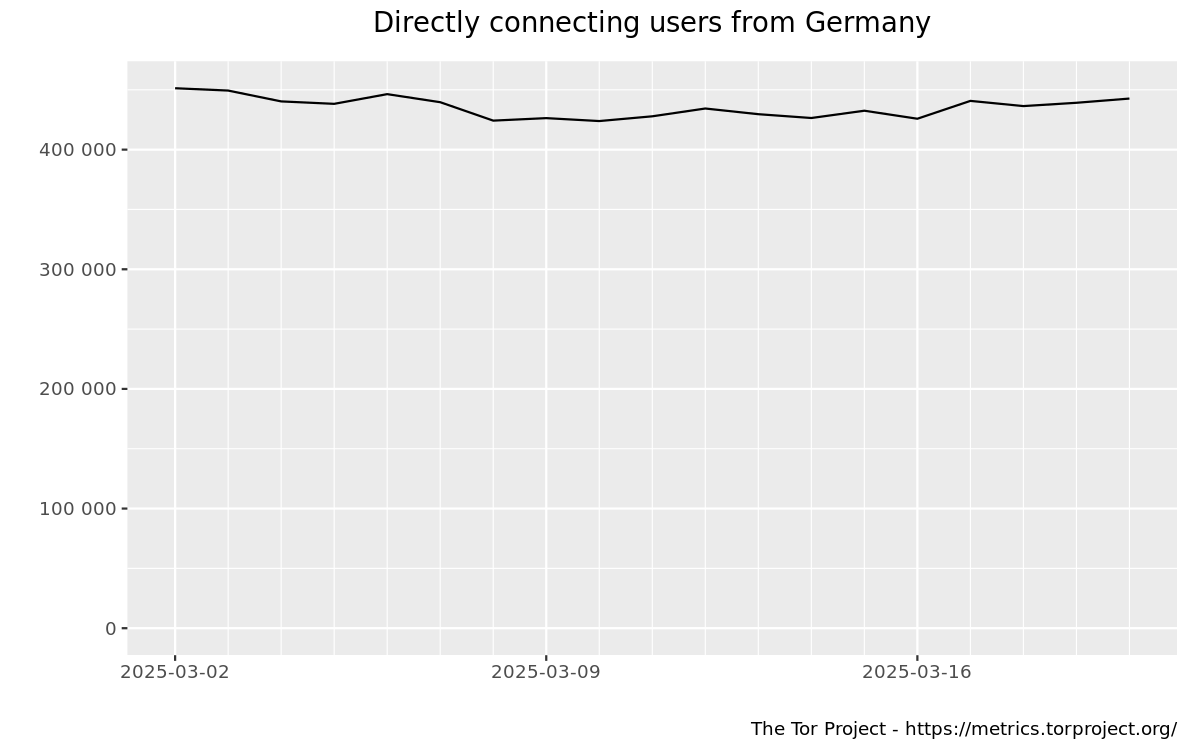
which is taken from our Metrics website. It suggests that 400,000 to 450,000 users1 are connecting daily to Tor from Germany. Given the flat graph over the 2 week window, this seems like a good candidate for a user baseline. However, things are already getting murkier if we increase the timeframe under consideration to 1 year:
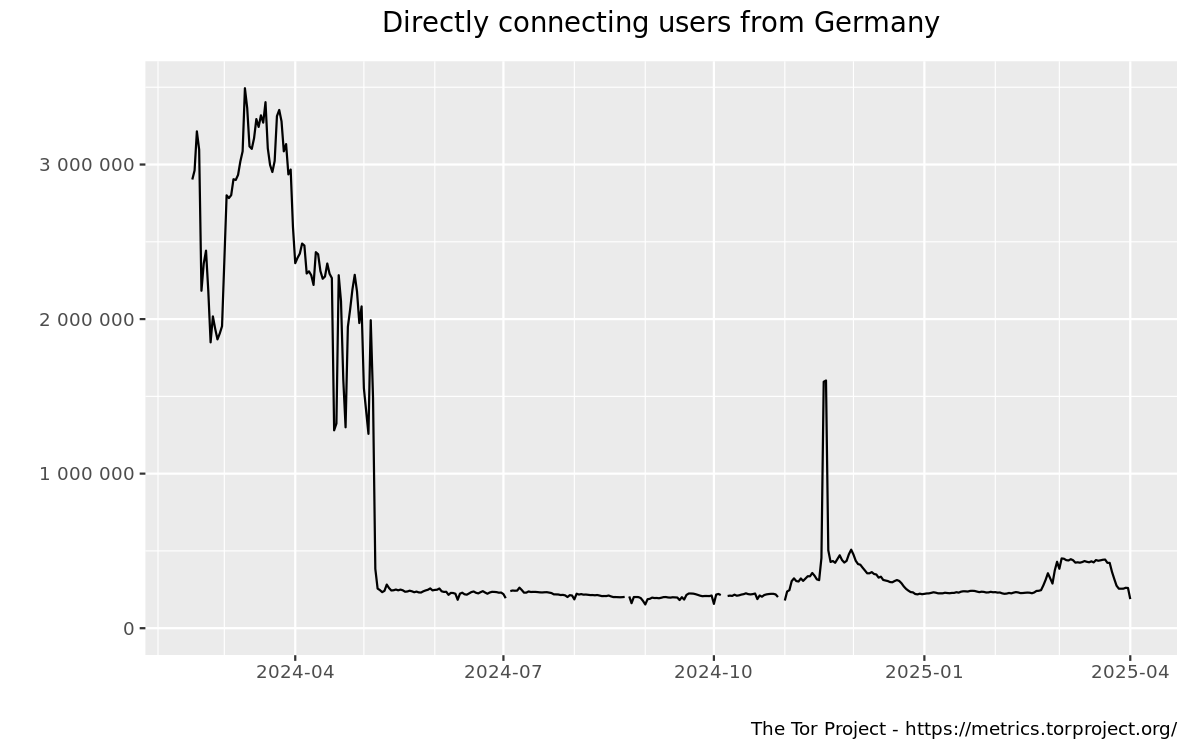
or look even further back:
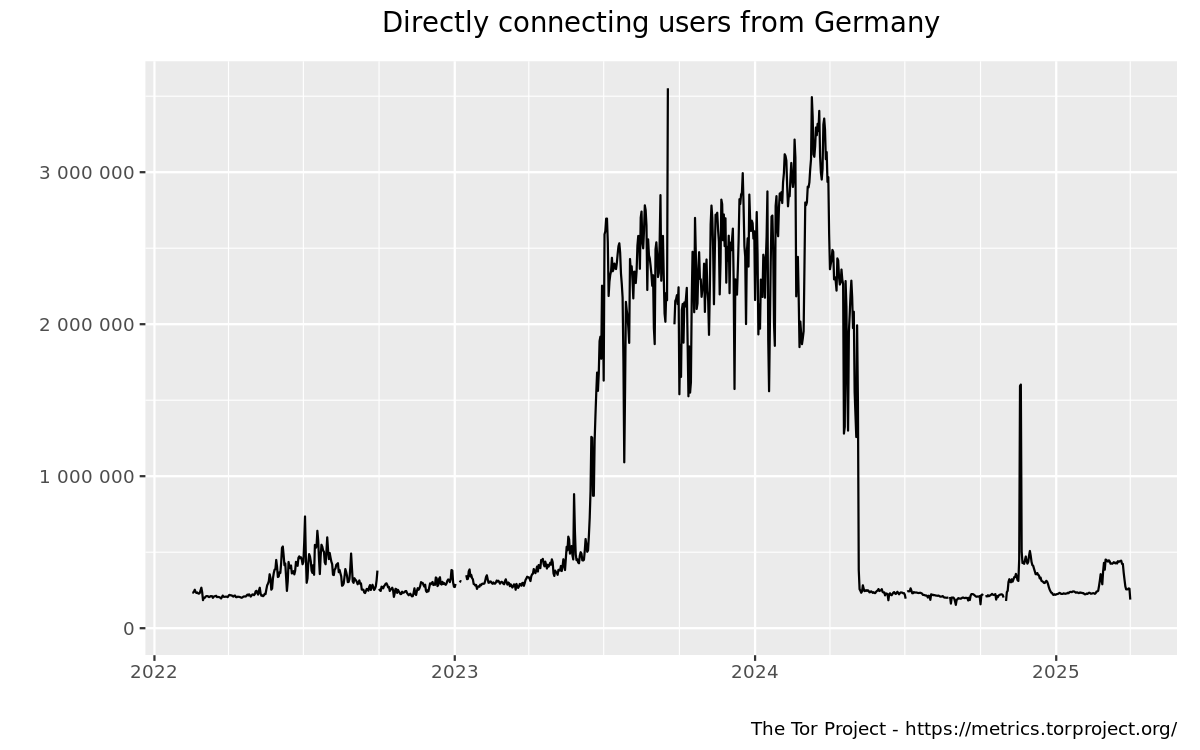
. Now big spikes in 2023/2024 look like the outliers and even the graph in the first image above seems to belong into this category. So, picking a proper timeframe is crucial.
Apart from finding the right timeframe for determining a proper baseline, we need to take other challenges into account as well. One of them is that our metrics and data we need to look at are quite different in kind. For instance, there are the numbers of directly connecting users to Tor (like the ones shown in the previous figures) which are not in our control and are, ideally, increasing over time, in a healthy way. In addition to that, we might have metrics governing some Tor protocal compliance/failure where already a single case of failure is pointing towards an anomaly. Determining baselines in both cases and others we didn't mention here explicitly needs to be done differently which means we can't even necessarily share the same methodology across all areas we are concerned about.
-
"users" might be misleading in this context as what we actually know is those numbers belonging to Tor clients. It could easily be the case that there are way less real users behind those numbers of Tor clients. For details on how we arrive at our bridge and directly connecting user numbers, see e.g. the technical report on counting daily bridge users. ↩